
Photometric measurements
In our in-house lighting laboratory, we measure luminaires using a state-of-the-art far-field goniometer – a service we also offer. The resulting digital light distribution curves, available in all common file formats, enable lighting designers to incorporate our luminaires into their lighting calculations. The measurement data also provides valuable information for sales and informs the further development and improvement of your luminaires.
equipment
The FLASHAAR light laboratory is equipped with a 2-axis far-field goniometer that measures luminaires up to 1,500 mm in length and with a maximum weight of 25 kg. All luminaires are measured at a stable operating temperature, with stable luminous flux, and at the highest resolution.
For the precise electrical measurement of LED light sources in particular, the lighting laboratory is additionally equipped with a special laboratory power supply. Constant voltage and constant current LEDs can thus be measured with high accuracy, as an alternative to the built-in AC power supply. An additional electronic ballast is not required.

Technical specifications of the far-field goniometer:
- Sensor distance: 0.5 – 50 m
- Measuring range: 10 lm – 1,000,000 lm
- Goniometer resolution: 51,200 steps / 360 degrees
- Spectral range: 360-830 nm (1,024 pixels) SONY ILX511B
- Lumen accuracy: < 4%
- Export: IES, LDT, PDF, Excel
- Power Analyzer for detailed analysis of electrical power
- Detailed view of color shades R1-R15
- Maximum lamp connection power 660W at 220V or 330W at 110V

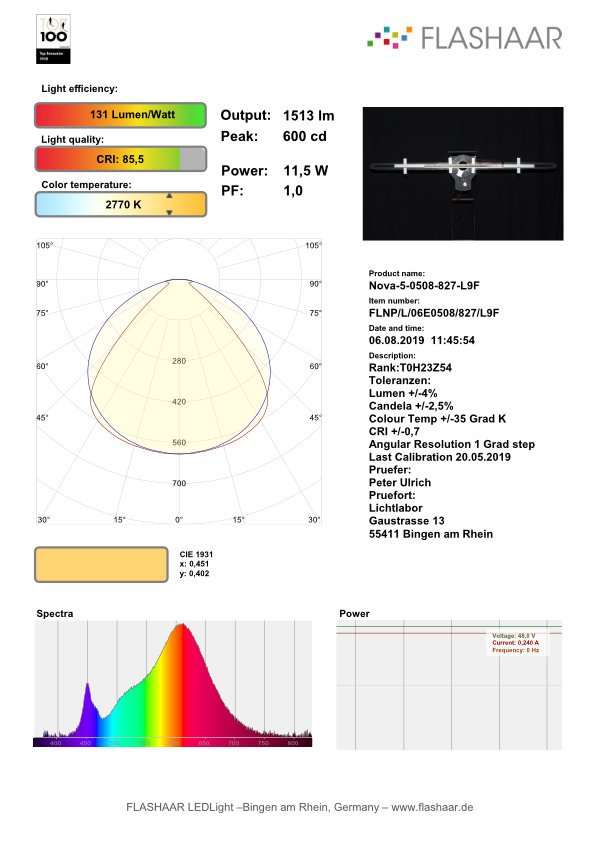
The following measurement data are determined:
- Luminous flux [lumens]
- Maximum luminous intensity [peak candela]
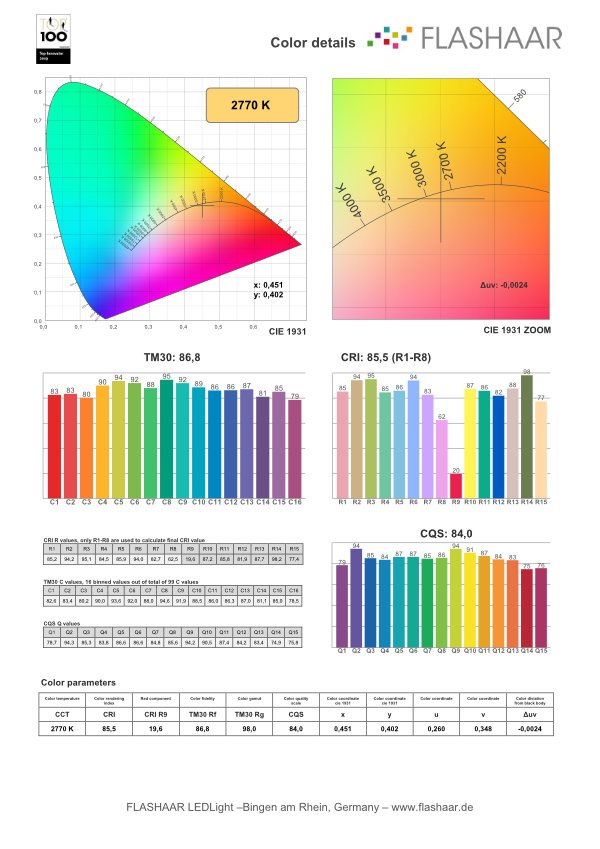
- Color temperature [Kelvin]
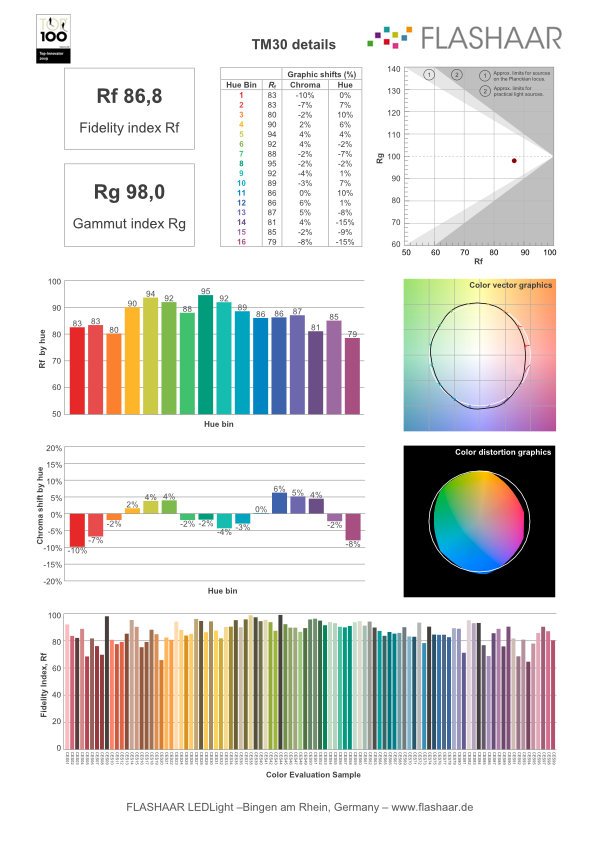
- Color spectrum [CIE1931, TM30 C values, CRI, CQS, CRI R values, CQs Q values]
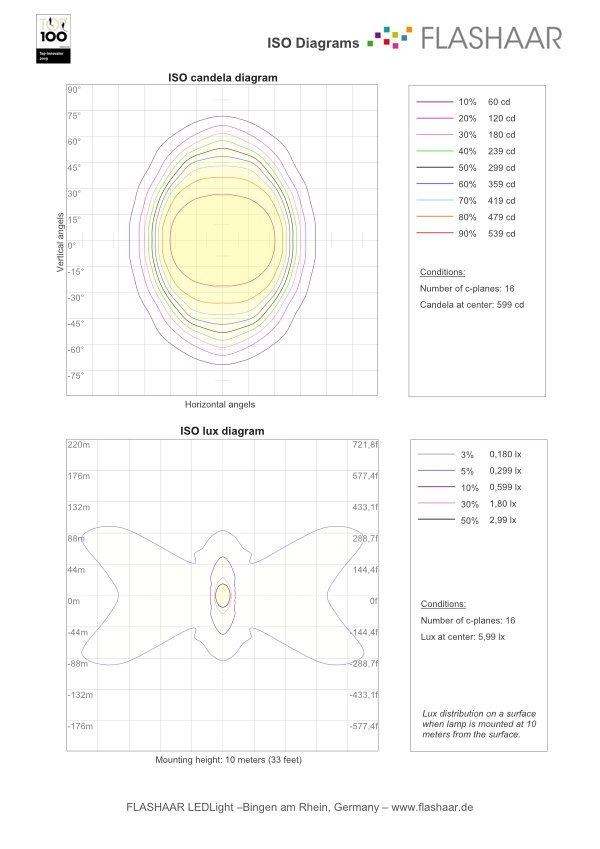
- ISO candela diagram
- ISO lux diagram
- Luminous intensity distribution [LVK]
- Beam angle
- Electrical consumption [W]
- Efficiency [lm/W, calculated]
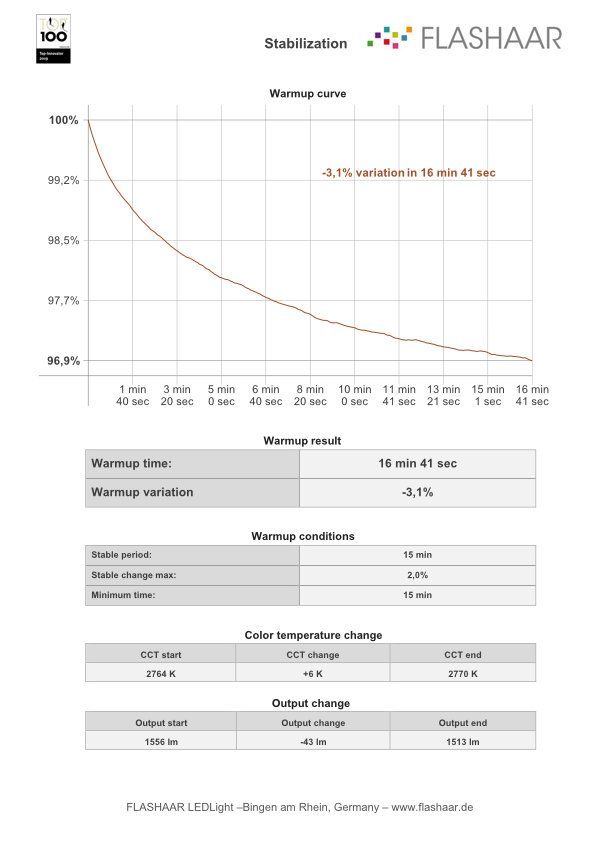
- Warm-up curve of the light (time, CCT start, CCT change, CCT end)
- UGR table
- Flicker percentage
- Flicker Index
- Flicker frequency
- SVM Index


Delivery:
We deliver the measurement results summarized in a PDF overview, as well as all measurement data in *.LDT and *.IES files. The LDT file contains all information about the luminaire, lamp, luminous intensity, and light distribution. The measurement data can be visualized, for example, using the LDT Editor from DIAL as a polar diagram, Cartesian diagram, cone diagram, and UGR table.
Renderings of the light distribution can be created from the IES file, for example with the IES-Viewer .
We would be happy to create a customized offer tailored to your lighting needs, requirements, and order quantities. Please contact us by email at , by phone at 06721-91950 or use our Contact page.

Flicker measurement
In our lighting laboratory, we also measure the flicker of light sources. Our flicker meter provides information about the percentage of flicker, the flicker index, the frequency, and the SVM index (stroboscopic effect visibility measure).
For our own luminaires, we use the flicker meter for continuous quality assurance and as a complement to our 2-axis far-field goniometer. We would be happy to measure your luminaires as a service – please contact us! You will receive the data from the photogoniometer and flicker measurement in a complete test report in PDF format, which can also include your logo upon request. The cost for measuring the flicker percentage, flicker index, frequency, and SVM index is €99 net.
